-
Zaporozhkoks produced 434.4 thousand tons of blast furnace coke.
3 July 16:15
-
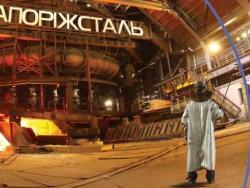
"Zaporizhstal" smelted 1.44 million tons of steel in six months
3 July 10:17
-
EU to cut duty-free steel imports by 47%
2 July 13:16
-
North American electric vehicle demand slows as hybrids gain traction and auto OEM strategies reset
1 July 12:39
-
Metinvest seeks to reduce its contribution to a steel project in Italy
26 June 18:17
-
Zaporizhstal is modernizing crane facilities to improve labor safety
16 June 14:19
-
Ukrainian metallurgical enterprises produced 537.8 thousand tons of rolled steel in May
9 June 14:13
-
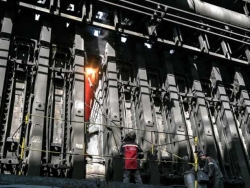
"Kametstal" reduced energy consumption for steel production
8 June 16:13
-
Metinvest-Shipping received UAH 165 million in profit in 2025
5 June 17:14
-
Net profit of Metinvest-Resource increased to UAH 7 million
4 June 12:14
-
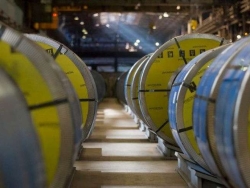
Zaporizhstal rolled steel shipments decreased to 1.03 million tons
3 June 10:10
-
Zaporozhkoks produced 77.7 thousand tons of coke in May
2 June 16:14
-
Metinvest Sichstal increased its net loss by 9.4% in the first quarter
2 June 15:13
-
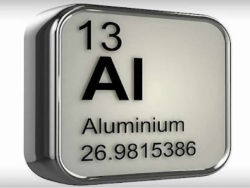
Aluminum rises to highest since March 2022
27 May 10:08
-
Chalco инвестирует $1 млрд в глиноземный завод в Гвинее
25 May 09:07
-
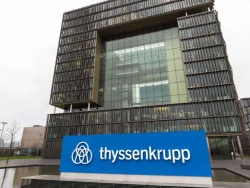
ThyssenKrupp completed the second financial quarter with a net loss
12 May 16:11
-
Zaporizhstal reduced production in April due to an unscheduled shutdown
11 May 10:09
-
KZVV more than doubled its net profit in 2025
6 May 11:08
-
Alumash shareholders will be offered to pay UAH 10 million in dividends for 2025
5 May 11:07
-
Zaporozhkoks produced 281.8 thousand tons of blast furnace coke in four months
4 May 18:09
-
Vyleviki Vilivkiv, Vilivkiv, Details, Partin - Litta Metalu for Gazify Models - Lost Foam Casting - Get Popularity
29 September 10:29
-
Machinobudini, decorative Vilivka, littei to the metala with vicoristani 3D printer TA 3D Fraser
29 September 10:36
-
Lokaln Loguvannya Litich Parts for Litti for models, gazif.
29 September 10:29
-
Zdosvіd Litty Partin for the Half -Street Lags: Supply
29 September 09:06
-
Vobronitniy Products for Models, Scho Gazifly, Yak ACCOUNT to the Vydlovnoy of the Machine
29 September 09:22
-

Sports equipment for Olympic records will be produced on S.Gothard machines
6 February 15:53
-

BRS for large pipelines
27 November 12:46
-

Welding costumes of various categories of protection
14 June 11:15
-

Sunny power plant calculator from Leader NRG Ukraine
12 June 12:21
-

Welded I -beam from the company Savvats
10 June 11:30
-

A check printer with a guarantee of proprietary originality
31 May 11:03
-

Perevoi Vispensnna Pubeen Systems Okholojenn
29 May 10:16
-

Creative marketing: shuffled packets with a logo for the pirdvishennya of respect to the brand
29 May 10:36
-

In the Yaki Prishens, the Modium Perethezhni door is stood up
25 April 15:52
-

Modern machines for any metalworking tasks
3 August 16:26
-

VPF "Litmash": high -quality color rental of copper, aluminum, brass and stainless alloys
26 June 14:06
-
Zapirna Furnik for the vide of vid compans Komtrans Ukraina
1 April 11:09
-

Vіtrini vid compani "Technocholod"
11 November 11:54
-

WDK-210 painting cameras and WDK-410 posts available in the company's warehouse!
20 October 00:58
-

Ordering warehouse equipment from Fortis Stroy company
27 September 10:22
Global interactive map
This map shows crude steel production data per region from 1996. The data was last updated in May 2017.
